MWD
We have developed a model-based water-layer demultiple (MWD) technique specifically designed to attenuate multiples in shallow water. This technique is similar to Surface Related Multiple Elimination (SRME) which has become the de facto standard for marine demultiple. SRME predicts multiples by convolving the data with successive estimates of the primaries in a recursive estimation procedure. It is very effective for both 2D and 3D multiple attenuation, in moderate to deep water. However, SRME can struggle with shallow water multiples, especially in the presence of a hard water bottom. In shallow water, the water-layer multiples can be recorded with significant amplitudes up to high orders, where the order of a multiple refers to the number of downward bounces from the sea surface. The high order water-layer multiples often overlap peg-leg multiples from deeper events. The subsequent adaptive subtraction must simultaneously match all orders of multiples and this often leads to poor multiple attenuation results.
What is MWD
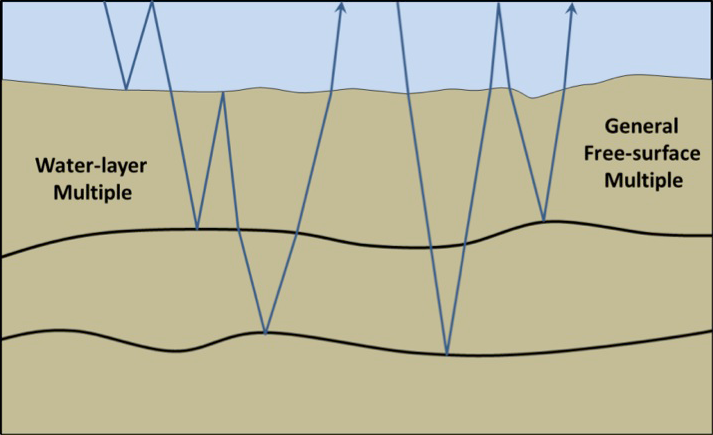
Figure 1. Types of free-surface multiple.
Figure 1 illustrates two different types of free-surface multiple. On the left is a water-layer multiple which is a multiple with at least one upwards bounce at the water bottom and one downward bounce at the surface. It is a special case of the more general free-surface multiple, which must have a bounce from the free-surface but may or may not include an upward bounce at the water bottom. SRME addresses both of these types of multiples. MWD on the other hand only seeks to attack the water-layer multiples and defers the remaining free-surface multiples for subsequent attenuation by SRME.
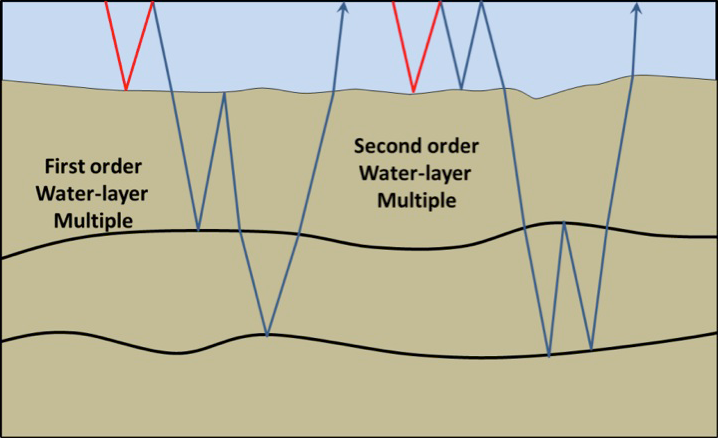
Figure 2. First and second order water-layer multiples.
Figure 2 shows two different orders of water-layer multiple for illustration. Each is constructed by combining the water layer Green’s function (shown in red) with a general raypath (shown in blue). The blue raypaths represent events in the recorded data. Applying the Green’s function to any order of water-layer multiple predicts the next order of water-layer multiple. In Figure 2, the second order multiple (right) is constructed by combining a water layer raypath (red) with the blue raypath which is a first order multiple (blue). Thus, all orders of water-layer multiple are predicted by operating on the data with the Green’s function.
To describe this in more detail we will examine shot-side multiple removal. Similar to SRME, the MWD method relies upon cross-convolution, in this case cross-convolution of the water-bottom Green’s function with the data. The water bottom Green's function was represented by the red raypath in Figure 2. The Green’s function used is the wavefield recorded at various points on the surface due to an impulse generated at the shot, with reflection from only the water bottom.
Given any input trace with shot position S and receiver position R, the water-layer multiples are then predicted by convolving the Green’s function from shot position S and receiver position X with the data from shot position X and receiver position R, where X is the downward reflection point (DRP) for the multiple. This is repeated for all sensible positions of X (based on aperture considerations), and the results are summed to produce our multiple estimate. This is illustrated for two such DRPs, X1 and X2, in Figure 3. Note that in Figure 3, position X2 would correspond to a non-specular downward reflection for this relatively flat geology. However, this cannot be known a priori, and it might correspond to a specular reflection for some other dipping reflector. The MWD method relies on Fermat’s principle, such that the summation will naturally select the specular events by constructive interference and remove others by destructive interference.
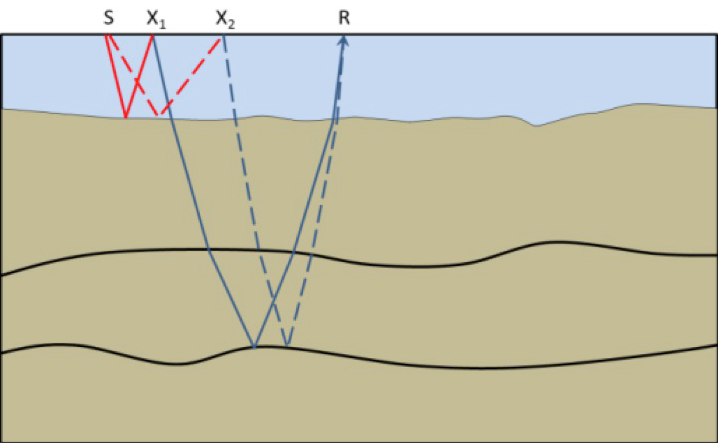
Figure 3. Construction of the water-layer multiple by using Green’s functions (red) convolved with traces (blue) for all possible DRPs. Just two (X1 and X2) are shown here.
East Coast Data Example
Figure 4 shows a comparison of a 2D marine line from the North Flemish Pass on the east coast of Canada. These data were provided by Jebco Seismic (Canada) Company. The data without multiple attenuation show many orders of shallow water multiples. The multiple attenuated data is the result of applying MWD, SRME and a pass of Radon multiple attenuation. The multiple attenuated result is a significant improvement over the original section and the primary energy is more readily interpreted.
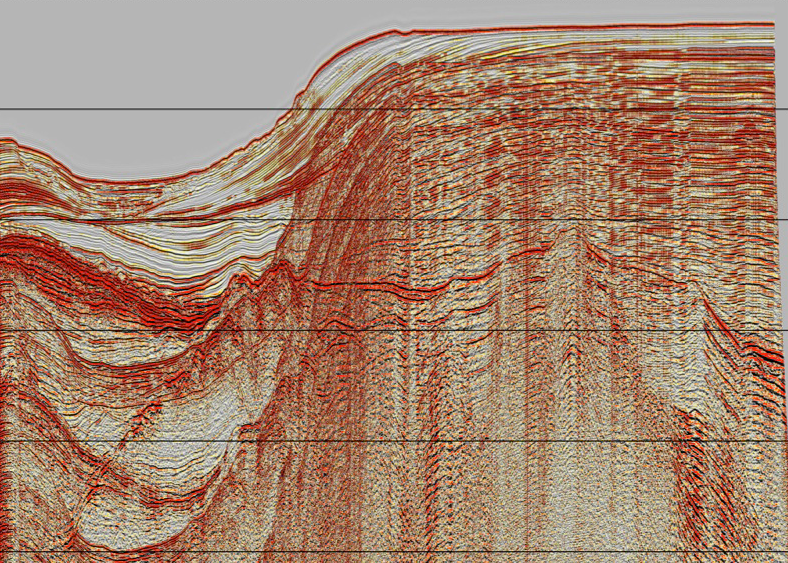
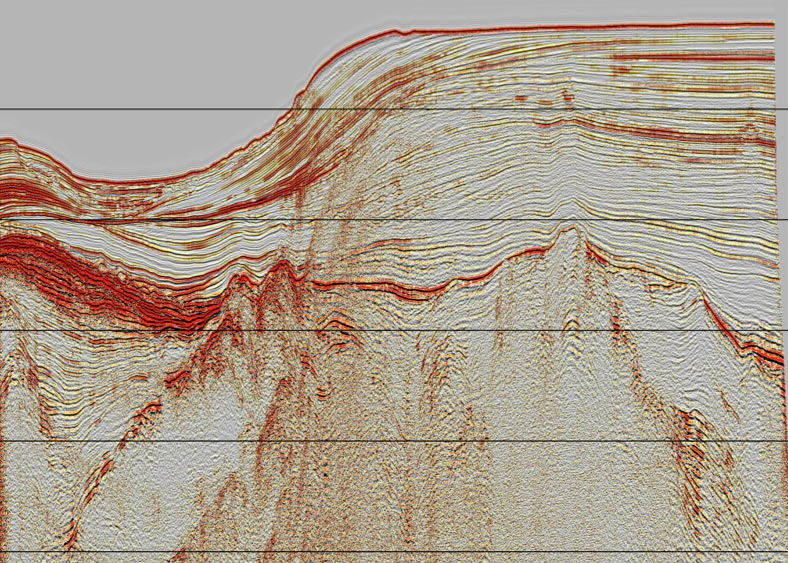
Figure 4. Comparison of 2D marine line without and with multiple attenuation. Multiple attenuation is the result of applying MWD, SRME and Radon.